

目前,针对足部形态参数的测量主要采用人工手动测量方法,即测量者利用尺规、量脚器等工具对待测参数进行直接测量.20世纪60年代,我国采用人工手动测量的方式进行了两次全国性足型普查,尽管这种方法相对简单,但是效率低、劳动强度大,而且测量结果也容易受到测量者的主观因素影响.Wang等[4]使用单幅二维图像实现了足长和足宽的自动测量,但由于缺乏三维信息,无法测量围度类参数.随着计算机科学技术和光电技术的进步,三维扫描和分析方法逐渐应用于人体测量领域,这种方法可以快速获得人体表面的三维形态,并且模型精度较高[5].然而,三维扫描仪器价格昂贵,目前尚无法广泛应用于临床诊断和治疗中,且针对足部进行扫描和自动测量的系统也并不多见.
为了解决上述问题,一些学者对利用三维模型进行足部测量的方法进行了探索和研究,但普遍存在特征点定位准确度差、测量参数少以及测量精度低等问题.Witana等[6]提出一种对激光扫描获得的足部三维模型自动测量18个参数的方法,该方法需要在扫描前对足部手动添加标记点,效率不高.刘国忠等[7]利用电荷耦合器件(CCD)相机设计了可以同时完成足部三维扫描和测量的系统,通过建立足后跟点和趾尖点的坐标系,自动提取10项足部参数,虽然不需要手动添加标记点,但并没有对该系统的测量精度进行验证.Kaashki等[8]提出基于深度学习的足部三维模型自动测量方法,该方法需要创建大量虚拟足部模型用于训练,并且在真实足部模型上的适配效果一般.近年来,扩展足部数据的测量范围、提高测量精度已成为足部测量领域的主要研究方向.Song等[9]抛弃传统的三维测量方法,提出一种面内变形的测量方法,这种方法精度高但可测的参数少.Wu等[10]通过提出新的坐标系对齐方法和特征点定位方法提高了测量精度,但坐标系对齐方法过于复杂且依赖于足部健康程度.Wang等[11]通过改进参数计算方法提高足部测量精度,但构建测量坐标系时对扫描设备依赖较大.
为了应对现有测量算法对扫描仪的依赖性高和测量精度不足的挑战,设计了一种新的测量算法.该算法可以自动定位站立姿态下足部三维模型中的足部特征点,并提取足部形态参数,整个过程无需人工添加标记点.此外,该算法改进了坐标系对齐方法,确保更准确的对齐效果,并适用于更广泛的足型范围.与传统测量方法相比,该算法不仅简化了测量流程,还显著提升了测量精度,同时可广泛应用于足部辅具的定制和鞋楦设计,为自主研发足部智能测量、分析和辅具设计系统提供了全面准确的数据支持.
1 研究方法
1.1 数据获取
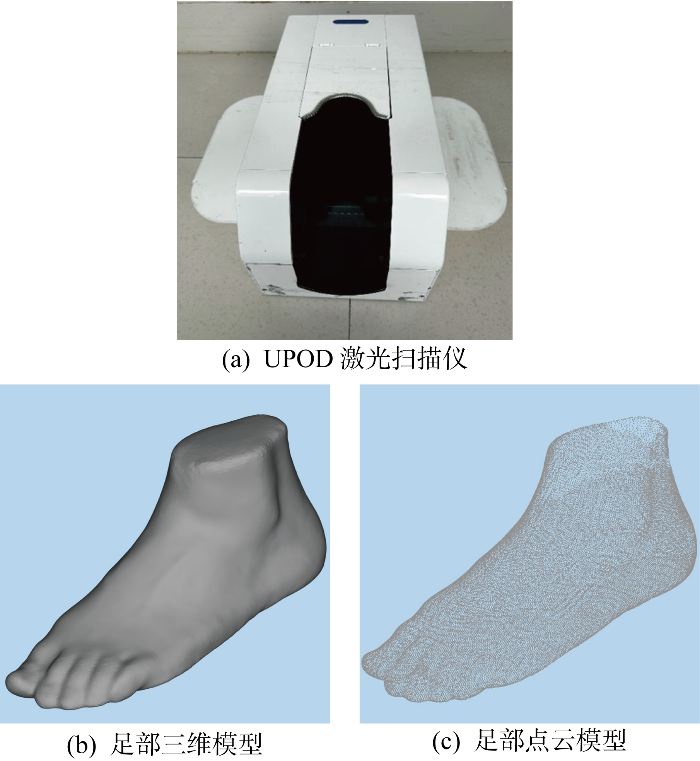
高精度的三维模型是进行后续测量分析的前提,研究中采用UPOD激光扫描仪来获取足部的三维模型.UPOD激光扫描仪的扫描精度为1 mm,使用它获取三维模型可以为测量和分析提供可靠的输入数据,进而验证足部参数自动测量方法的可行性.共有来自华山医院足踝外科和内分泌科的93名患者参与了本次研究,对于研究内容,所有患者均知情并签署了同意书.扫描仪获得的三维模型如图1所示,研究中使用点云库(point cloud library, PCL)将足部模型转化为点云,对点云进行测量和分析.
图1
1.2 坐标系对齐
在进行测量之前,需要建立统一的坐标系,即进行坐标系对齐.完整的测量坐标系包括原点和方向.将足底所在平面作为坐标系的一个面并以穿过足底中间的一条线作为坐标系的轴线是最常用的足部坐标系对齐方法.对于足底面的获取,大部分研究[5-6,12]直接使用扫描仪的采集平面,这使得模型坐标系的建立依赖于特定的扫描设备,无法适用于更广泛的扫描场景,例如使用手机扫描.对于足部轴线的位置,使用最广的确定方法包括两种:Brannock法和第2趾法.Brannock法通过连接足跟点和第1跖趾关节外凸点3.81 cm处的点来确定轴线[13],对所有脚都使用相同的距离,会导致在窄脚和宽脚的个体中出现明显的偏差.第2趾法通过连接足跟点和第2跖趾尖点来确定轴线,虽然不依赖足部的肥瘦程度,但受脚趾处的健康影响很大,对存在跖趾畸形如锤状趾的个体存在问题.
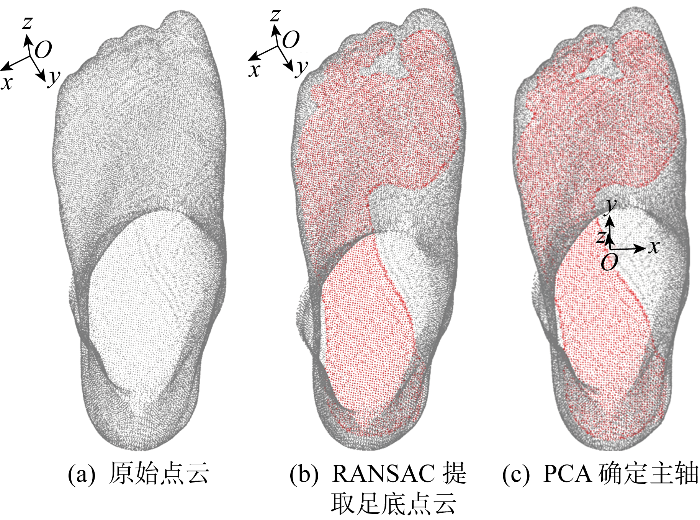
为了解决上述问题,本文提出一种使用随机采样一致性算法(RANSAC)从站立姿态下的足部点云提取足底平面及其法向量的方法.首先框选足底点云的大致范围,然后通过迭代随机抽样与平面模型拟合,在该点云中选择出最符合平面的点集,实现鲁棒的平面估计和分割.该方法不依赖于特定的扫描设备,能够自动提取站立姿态下的足底平面.同时,提出一种使用主成分分析(PCA)确定足部轴线方向的方法.将整足投影到RANSAC提取的足底面,再对投影点云使用PCA提取主轴.PCA可以保证数据在只保留一个维度的情况下信息损失最小,通过该方法获取的主轴可以最大程度地保留足部形态信息.最后通过比较整足质心与足底质心的相对关系,确定各个坐标系的正方向,从而完成坐标系的对齐.3种方法确定足部轴线的位置如图2所示,完整的坐标系对齐过程如图3所示.
图2
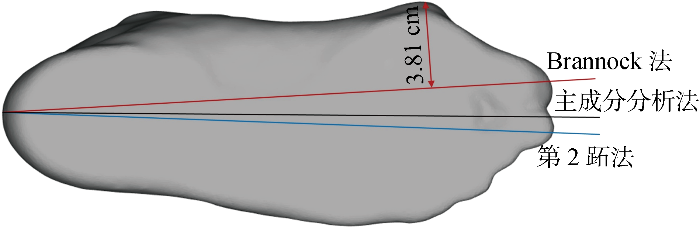
图2
3种方法确定足部轴线的位置对比
Fig.2
Comparison of position of foot axis using three methods
图3
1.3 特征点自动定位
在足部参数测量过程中,每个待测参数均通过相关特征点的定位计算得出.因此,特征点的准确定位是确保足部参数测量精确度的关键因素.根据鞋楦定制和辅具定制的需要,结合之前学者的研究[6,14
表1 足部参数和特征点定义
Tab.1
| 类别 | 参数 | 定义 |
|---|---|---|
| 长度 | 足长,L1/mm | 最长趾尖点P1与足后跟点P15在y方向的距离 |
| 足弓长,L2/mm | P15与第1跖趾关节外凸点P4在y方向的距离 | |
| 足跟到内踝长,L3/mm | P15与内踝尖点P13在y方向的距离 | |
| 足跟到外踝长,L4/mm | P15与外踝尖点P12在y方向的距离 | |
| 足宽,L5/mm | P4与第5跖趾关节外凸点P5在x方向的距离 | |
| 中足宽,L6/mm | 50%足长处横坐标x最大的点P7与最小的点P8在x方向的距离 | |
| 足踝宽,L7/mm | P12与P13在x方向的距离 | |
| 足跟宽,L8/mm | 过辅助点P14垂直y轴的直线与整足交点间的距离 | |
| 第1跖趾关节顶高,L9/mm | 拇指最高点P3到xOy平面的距离 | |
| 第1跖骨上缘点高,L10/mm | 第1跖骨最高点P6到xOy平面的距离 | |
| 足弓高,L11/mm | 内侧足弓最高点P10到xOy平面的距离 | |
| 中足高,L12/mm | 50%足长处足部最高点P9到xOy平面的距离 | |
| 内踝高,L13/mm | P13到xOy平面的距离 | |
| 外踝高,L14/mm | P12到xOy平面的距离 | |
| 围度 | 跖围,C1/mm | 过P4、P5、P6的平面与足相交所得曲线长 |
| 跗围,C2/mm | 过P10且垂直yOz的平面与足相交所得的最短曲线长 | |
| 兜跟围,C3/mm | 过P15和舟上弯点P11且垂直yOz的平面与足相交所得的曲线长 | |
| 角度 | 拇外翻角,α1/(°) | P4和拇指外凸点P2在xOy平面投影点连线与y轴夹角 |
| 跖趾斜宽角,α2/(°) | P4和P5在xOy平面投影点的连线与x轴夹角 | |
| 自然前翘角,α3/(°) | P1和P3的连线与xOy平面的夹角 |
图4
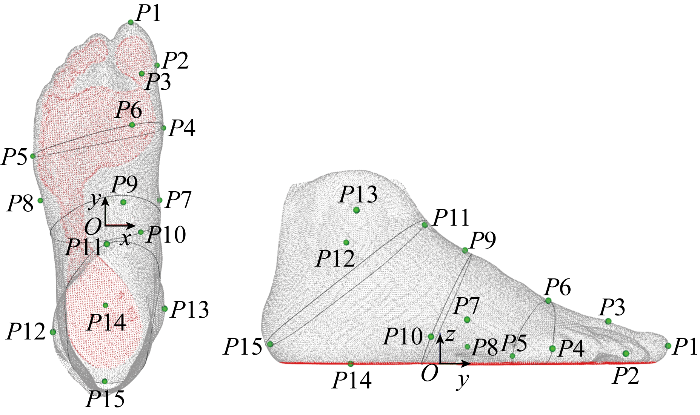
图5
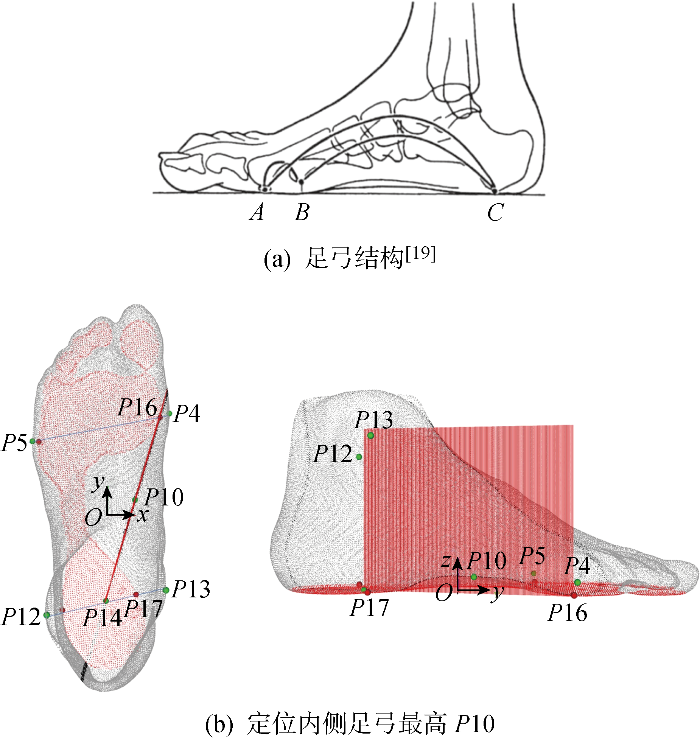
通过迭代查找使曲线最短的点获取 P11.具体方法是在足背曲线上任意选取一点P,然后通过过点P和P15的垂直yOz平面与整个足相交,得到截面点云M.使用凸包法计算截面点云M的围度.随着足背曲线上的点P的位置改变,围度也在不断变化,最短围度对应的足背曲线上的点即为舟上弯点P11,此时的最短围度即为兜跟围C3.跗围C2的获取原理与C3 相同,只是选取点的范围不同.
P14为用于计算足跟宽的辅助点,在本研究中指P12和P13的连线投影至xOy平面与y轴的交点.在鞋类设计和制造过程中,足跟宽度是影响鞋子的合适度和舒适度的重要参数之一,测量时认为是距离足后跟点40 mm处的宽度.但由于每个人的足部形状和尺寸各不相同,对较短的脚使用该标准测量足跟宽将导致测量结果偏大.因此改进了上述足跟宽度测量方法使其不依赖于足部长度.
1.4 形态参数自动计算
根据不同的计算方法,待测形态参数可以分为长度、围度和角度3类.长度类参数直接通过相应特征点在坐标轴上的数值相减获得,角度类参数则可以通过余弦定理计算,围度类参数则使用凸包法获取截面点云的外轮廓周长[11].
1.5 自动测量软件实现
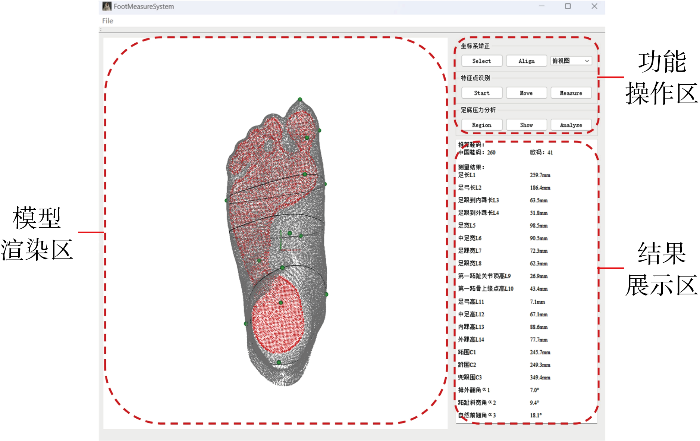
使用Visual Studio 2017作为软件开发平台、Qt 5.12.6作为界面开发工具、PCL 1.8.1作为渲染和计算库完成足部自动测量软件的开发.如图6所示,该软件包括3个核心区:模型渲染区、功能操作区和结果展示区.在模型渲染区,用户能够在整个测量周期里观察和更新足部模型、特征点以及围度曲线等信息.功能操作区主要负责测量流程的全局控制和协调,用户通过该区域能够便捷地管理整个测量过程的步骤.结果展示区则负责呈现测量过程中产生的中间变量以及最终的测量结果.该软件还具备人机交互功能,能够人工调整特征点的位置以满足个性化测量需求.整体上为用户提供了一个清晰的视觉和操作界面,以便用户深入了解测量的进展和成果.
图6
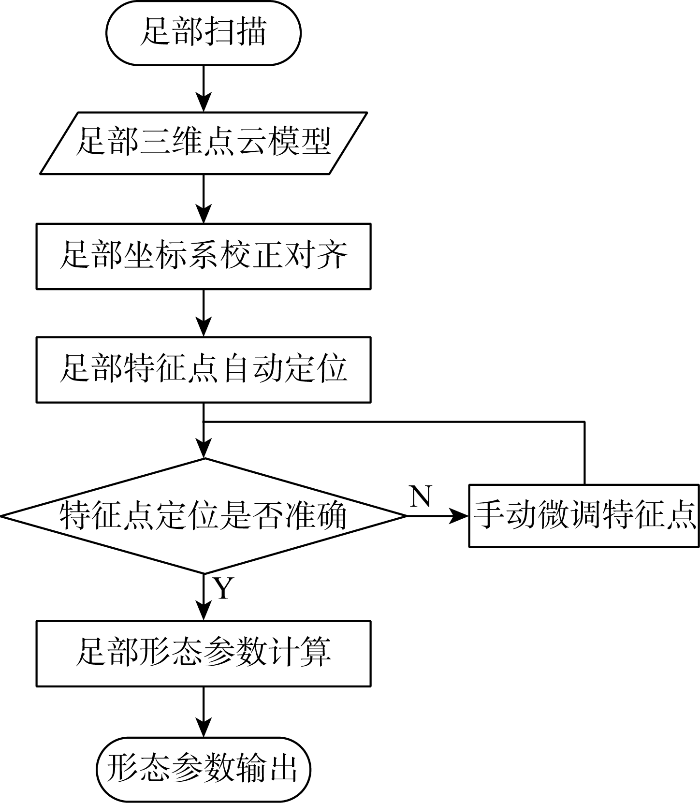
测量流程如图7所示,主要包括以下关键步骤:①用户导入足部的三维扫描模型;②通过框选出足底的大致区域完成坐标系对齐;③系统自动定位关键特征点,若发现特征点存在偏差,用户可以进行手动微调以确保特征点的精准定位;④系统自动计算特征参数,完成对足部形态参数的全面自动测量与分析.
图7
2 研究结果
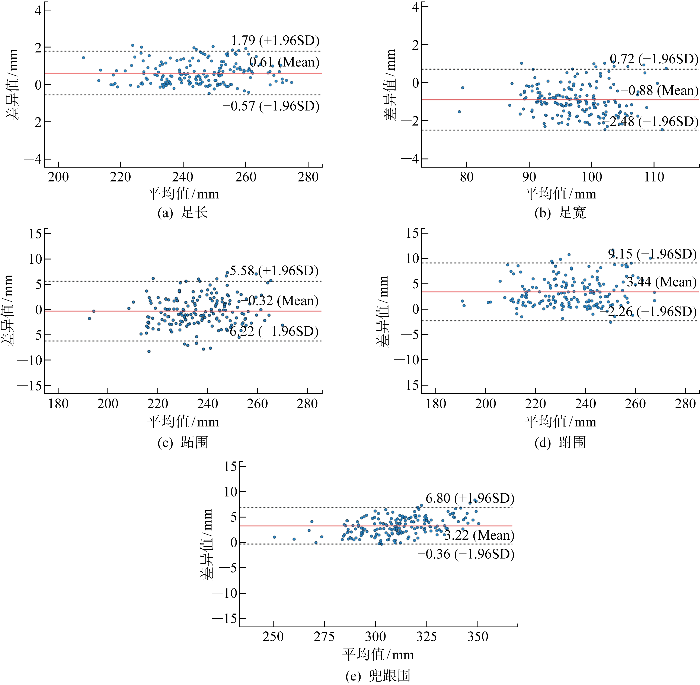
选取鞋楦和辅具设计中最关键的5个参数:足长、足宽、跖围、跗围和兜跟围进行测量算法的评价.对93名受试者站立姿态下的双脚(186个足部模型)进行测量,以UPOD分析软件的测量结果为基准,从准确度、重复性和一致性方面验证算法的有效性.
使用平均绝对误差(MAE)和平均相对误差(MAPE)评估测量的准确度,这两个指标可用于衡量测量值与真实值之间的差异程度,定义如下:
式中:
表2 两种测量方法测量结果对比
Tab.2
| 参数 | 测量值/mm | UPOD 测量值/mm | MAE/mm | MAPE/% | ICC(3, 1) | |||
|---|---|---|---|---|---|---|---|---|
| 第1次 | 第2次 | 第3次 | 平均值 | |||||
| 足长 | 244.85 | 244.86 | 244.84 | 244.85 | 244.25 | 0.64±0.56 | 0.26±0.23 | 0.999 |
| 足宽 | 97.08 | 97.07 | 97.09 | 97.08 | 97.96 | 1.04±0.60 | 1.05±0.60 | 0.998 |
| 跖围 | 236.26 | 236.24 | 236.27 | 236.26 | 236.58 | 2.43±1.80 | 1.03±0.76 | 0.997 |
| 跗围 | 232.19 | 232.30 | 232.41 | 232.30 | 235.75 | 3.56±2.77 | 1.50±1.14 | 0.992 |
| 兜跟围 | 309.43 | 309.44 | 309.33 | 333.40 | 309.40 | 3.23±1.80 | 1.02±0.55 | 0.998 |
图8
3 讨论
深入研究足部自动测量过程中坐标系对齐和特征点定位的方法,最终成功实现了对足部形态参数的高精度测量.研究基于UPOD激光扫描仪的三维扫描模型,并利用UPOD分析软件的测量结果进行对比分析.相比UPOD分析软件的测量方式,该测量方法具有以下优势:
(1) 坐标系对齐方法更通用.该坐标系对齐方式适用于各种足部形态,不局限于正常足型.
(2) 可定制的测量参数.允许用户自定义测量参数以提取更多与足部形态相关的信息,而UPOD分析软件只能测量固定数目的参数.
(3) 跨设备通用性.不仅适用于UPOD扫描仪获得的三维模型,还可以用于其他设备获取的模型,提高了测量方法的通用性和可迁移性.
(4) 研究成果可以作为自主研发的足部智能测量、分析与辅具设计系统的一部分,为后续的足部辅具智能适配与梯度减压鞋垫设计提供数据支持.
测量算法也存在一些不足,例如在数据获取方面,由于受到研究设备和资源的限制,本研究仅采用了UPOD激光扫描仪来获取三维模型.实际上,不同的扫描仪在获取三维模型时具有不同的精度水平,这可能会引发测量结果方面的潜在误差.因此,未来研究需要利用不同型号的扫描设备获取数据,以便对算法的测量精度进行更全面和综合的评估.在测量结果方面,围度类参数的MAE均比长度类参数大.通过Bland-Altman图可以观察到跗围和兜跟围的平均偏差均为+3 mm,即算法跗围和兜跟围的测量结果普遍比UPOD激光扫描仪自动测量的结果偏大.这可能是因为本文算法对这两个围度的定义和激光扫描仪对这两个围度的定义以及计算方法略有不同.后续将进一步研究和改进算法以提高围度类参数的测量准确度.
此外,本文定位内侧足弓最高点的方法为足型分类提供了新的参考依据.传统的足型分类使用的弓高指数通过计算50%足长处足背点的高度与足长的比值间接反映足弓的情况[22].相比之下,内侧足弓最高点可以直接反映足弓的高度,因此在足型分类方面具有很高的潜在应用价值.
4 结语
提出一种基于三维点云的足部形态非接触测量算法.该算法无需手动添加标记点,能够实现坐标系的自动对齐、特征点的准确定位和参数的自动测量.通过对准确度、重复性和一致性的验证,证明了该测量算法具有高精度和良好的可靠性.与传统仅适用于健康足的测量方法相比,本文坐标系对齐方法适用于任意站立姿态下的足部形态参数测量,更具普适性和临床实用价值.测量结果可应用于足型诊断、鞋楦设计、辅具适配与个性化辅具设计等领域,也可以应用于足型普查和足型数据库建立等大批量测量中.后续研究将基于该成果,结合手机扫描重建、梯度减压鞋垫设计与制造等技术,开发出集扫描、测量、诊断和辅具适配于一体的智能足部诊疗系统,促进足部医疗和工程领域的发展.
参考文献
基于生物力学的足部保健产品研究
[J].
Foot health product based on biomechanical characteristics
[J].
矫形鞋垫的作用机制及临床研究进展
[J].
Mechanism and clinical research progress of orthopedic insole
[J].
A research on foot size measurement algorithm based on image
[J].
Semi-automatic measurements of foot morphological parameters from 3D plantar foot scans
[J].
DOI:10.1186/s13047-021-00461-z
PMID:33731179
[本文引用: 2]

Foot healthcare research is focusing increasingly on personalized orthotic and prosthetic devices to address patient-specific morphology and ailments. Customization requires advanced 3D image processing tools to assess foot and leg geometrical parameters and alterations. The aim of this study is to present a new software for the measurement of the foot shape from 3D scans of the foot plantar surface.A Kinect-based scanning device was used to acquire the 3D foot shape of 44 healthy subjects. A software was developed in Matlab to measure the foot main morphological parameters from foot scans. Principal Component Analysis was used to orientate the foot scans with respect to the same reference system. Accuracy, via percentage errors and Bland-Altman plots, and correlation of the software-based foot parameters were assessed against manual measurements. A normalized Arch Volume Index (nAVI) was proposed and correlated to the traditional Arch Index. Test-retest Intraclass Correlation Coefficient was used to assess the inter-session repeatability of foot measurements.The average percentage error between software and manual measurements was 1.2 ± 0.8% for foot length, 9.1 ± 3.7% for foot width, 22.3 ± 13.5% for arch height and 23.1 ± 12.7% for arch depth. Very strong correlations were observed for foot length (R = 0.97) and foot width (R = 0.83), and strong correlations for arch height (R = 0.62) and arch depth (R = 0.74). nAVI was negatively correlated to the Arch Index (R = -0.54). A small difference was found between software and manual measurements of foot length (Δ = 0.92 mm), a software overestimation of foot width (Δ = 8.6 mm) and underestimation of arch height (Δ = -1.4%) and arch depth (Δ = -11%). Moderate to excellent repeatability was observed for all measurements (0.67-0.99).The present software appears capable to estimate the foot main morphological parameters without the need for skin markers or for identification of anatomical landmarks. Moreover, measurements are not affected by the foot orientation on the scanning device. The good accuracy and repeatability of measurements make the software a potentially useful operator-independent tool for the assessment of foot morphological alterations and for orthotics customization. nAVI may be used for a more realistic classification of foot types when 3D foot images are available.
Foot measurements from three-dimensional scans: A comparison and evaluation of different methods
[J].
激光线扫描足部三维测量方法及其应用
[J].
3-D foot measurements using laser-linescanning
[J].
A deep-learning-based approach to automatically measuring foots from a 3D scan
[C]//
Foot measurement using 3D scanning model
[J].
Automatic foot scanning and measurement based on multiple RGB-depth cameras
[J].
A 3D foot shape feature parameter measurement algorithm based on Kinect2
[J].
The use of 3D surface scanning for the measurement and assessment of the human foot
[J].
DOI:10.1186/1757-1146-3-19
PMID:20815914
[本文引用: 1]
Background: A number of surface scanning systems with the ability to quickly and easily obtain 3D digital representations of the foot are now commercially available. This review aims to present a summary of the reported use of these technologies in footwear development, the design of customised orthotics, and investigations for other ergonomic purposes related to the foot. Methods: The PubMed and ScienceDirect databases were searched. Reference lists and experts in the field were also consulted to identify additional articles. Studies in English which had 3D surface scanning of the foot as an integral element of their protocol were included in the review. Results: Thirty-eight articles meeting the search criteria were included. Advantages and disadvantages of using 3D surface scanning systems are highlighted. A meta-analysis of studies using scanners to investigate the changes in foot dimensions during varying levels of weight bearing was carried out. Conclusions: Modern 3D surface scanning systems can obtain accurate and repeatable digital representations of the foot shape and have been successfully used in medical, ergonomic and footwear development applications. The increasing affordability of these systems presents opportunities for researchers investigating the foot and for manufacturers of foot related apparel and devices, particularly those interested in producing items that are customised to the individual. Suggestions are made for future areas of research and for the standardization of the protocols used to produce foot scans.
Parametric design of custom foot orthotic model
[J].
A computer-aided design system for foot-feature-based shoe last customization
[J].
The Heidelberg foot measurement method: Development, description and assessment
[J].
脚型三维测量与特征参数自动提取
[J].
3D measurement and feature parameters automatic extraction of foot
[J].
三维足型参数自动测量系统设计与实现
[J].
Design and implementation of 3D foot size measurement system
[J].
A guideline of selecting and reporting intraclass correlation coefficients for reliability research
[J].
DOI:10.1016/j.jcm.2016.02.012
PMID:27330520
[本文引用: 1]
Intraclass correlation coefficient (ICC) is a widely used reliability index in test-retest, intrarater, and interrater reliability analyses. This article introduces the basic concept of ICC in the content of reliability analysis.There are 10 forms of ICCs. Because each form involves distinct assumptions in their calculation and will lead to different interpretations, researchers should explicitly specify the ICC form they used in their calculation. A thorough review of the research design is needed in selecting the appropriate form of ICC to evaluate reliability. The best practice of reporting ICC should include software information, "model," "type," and "definition" selections.When coming across an article that includes ICC, readers should first check whether information about the ICC form has been reported and if an appropriate ICC form was used. Based on the 95% confident interval of the ICC estimate, values less than 0.5, between 0.5 and 0.75, between 0.75 and 0.9, and greater than 0.90 are indicative of poor, moderate, good, and excellent reliability, respectively.This article provides a practical guideline for clinical researchers to choose the correct form of ICC and suggests the best practice of reporting ICC parameters in scientific publications. This article also gives readers an appreciation for what to look for when coming across ICC while reading an article.
Non-radiographic validity and reliability measures for assessing foot types: A systematic review
[J].
